 Skip to content
Reports & Dashboards
- Home
- Zaris Features
- Reports & Dashboards
Reports & Dashboards Module – User Guide
The Reports & Dashboards module in Zaris CRM serves as your central hub for monitoring, analyzing, and understanding business performance. It combines two powerful tools Dashboards for real-time visual insights and Reports for detailed data analysis helping you make informed decisions faster and smarter.
Visual command center
Real-time KPI tiles, calendars and charts give a clear snapshot of sales, tickets and projects.
Custom dashboards
Design your own workspace add widgets, customize layout and switch between saved dashboards.
Reports functionality
Pre-built reports, filter and refine data, then export and share for audits and forecasting.
Dashboard: Your Visual Command Center
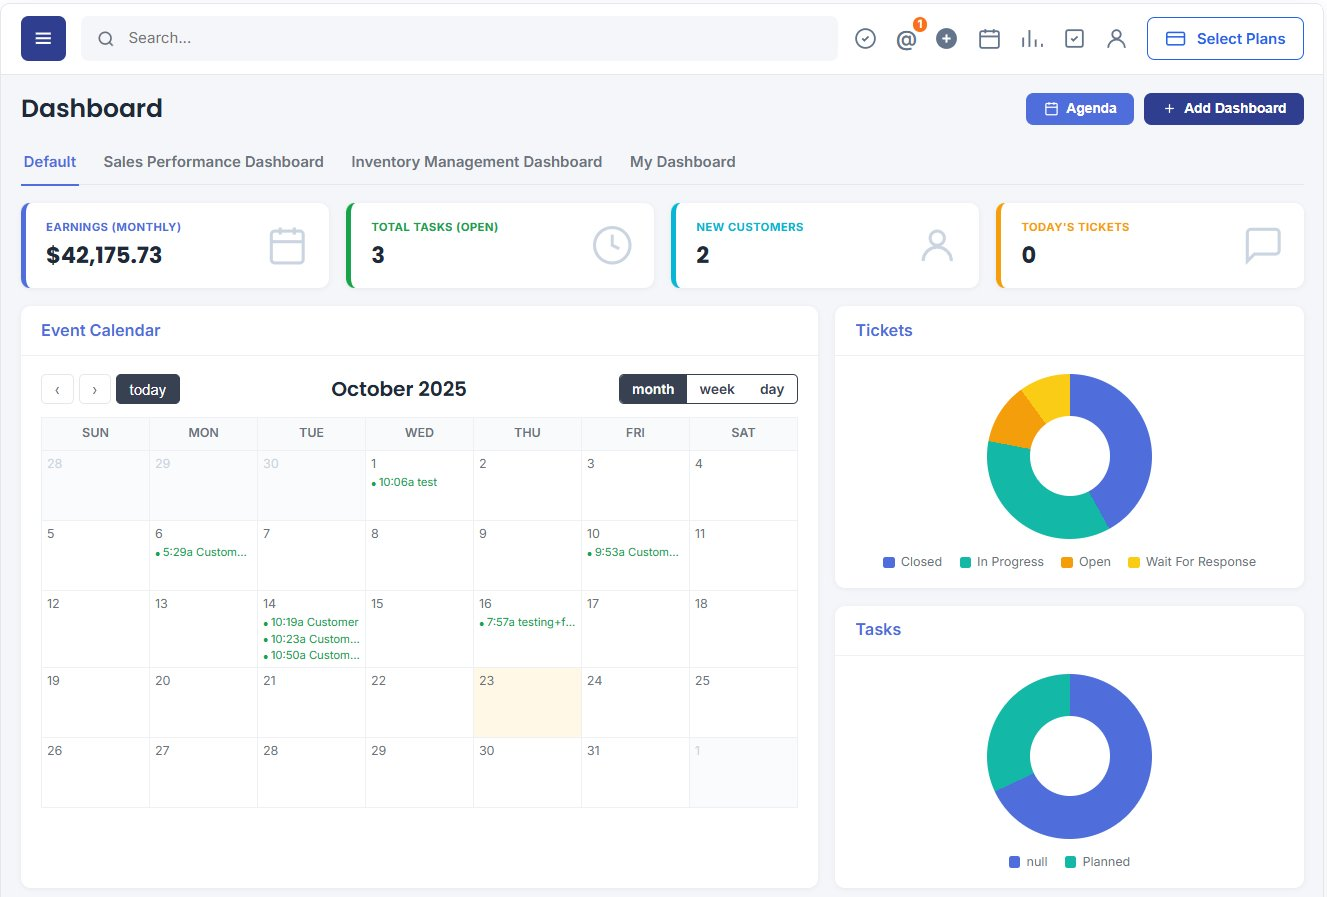
The Dashboard acts as your visual command center, offering a clear, real-time snapshot of key business metrics (KPIs). It helps users quickly track performance, identify trends, and make data-driven decisions without having to dig through raw data.
Dashboards are dynamic and interactive, ensuring that important information is always at your fingertips whether it’s sales growth, open tickets, or project progress.
- Creating a Custom Dashboard — design a workspace aligned to your goals.
- Adding Widgets — KPI tiles, calendars, charts and record lists.
- Customize Layout — arrange and resize widgets to fit your workflow.
- Switch Between Dashboards — Default, Sales Performance, Inventory and more.
Deep, Structured Analysis
While dashboards deliver quick visual insights, the Reports section provides granular detail and historical data for audits, performance reviews and forecasting. Use pre-built reports, filter and refine data, then export and share with widget reports pinned right on your dashboard for one-click access.
- Pre-Built Reports — start instantly with ready-made report templates.
- Filter & Refine Data — narrow results by module, status, owner and date.
- Export & Share Reports — send summaries to your team or export for review.
Reports vs. Dashboards: Two Tools, One Module
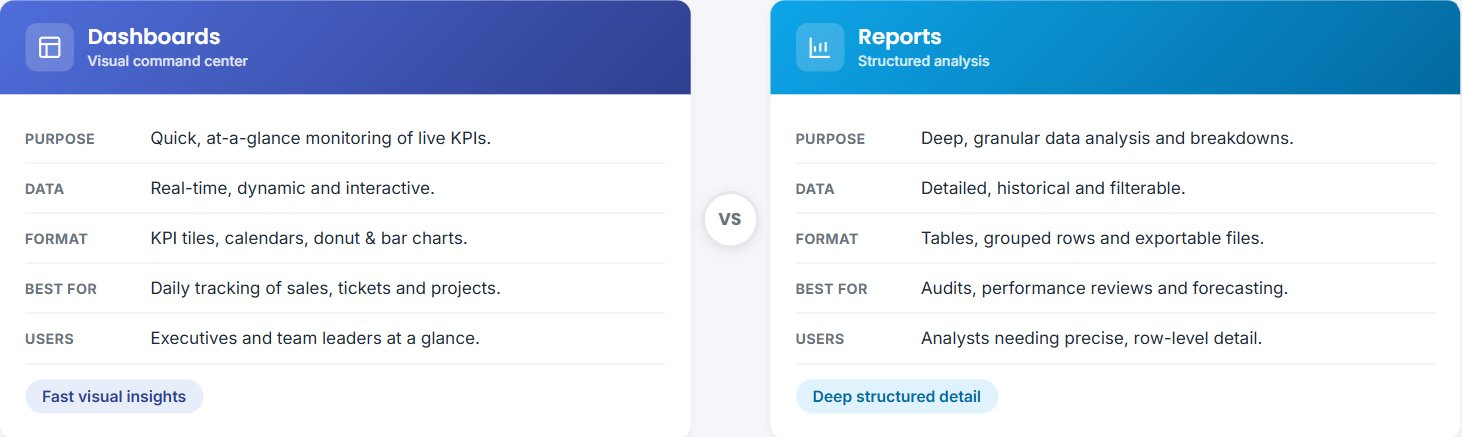
Dashboards and Reports work side by side. Dashboards give quick, visual, real-time snapshots for everyday monitoring, while Reports deliver deep, structured, historical analysis for audits, reviews and forecasting. Use them together to cover every decision.
Dashboards (Key Feature)
The Dashboard feature allows users to design their own workspace, ensuring every metric and report aligns perfectly with their personal or departmental goals.
- Click “Add Dashboard” to create a new one.
- Give your dashboard a unique and descriptive name, such as My Sales Overview or Support Team Tracker.
Widgets are the building blocks of your dashboard. You can add interactive elements such as:
Event Calendar – Displays upcoming meetings, deadlines, and events.
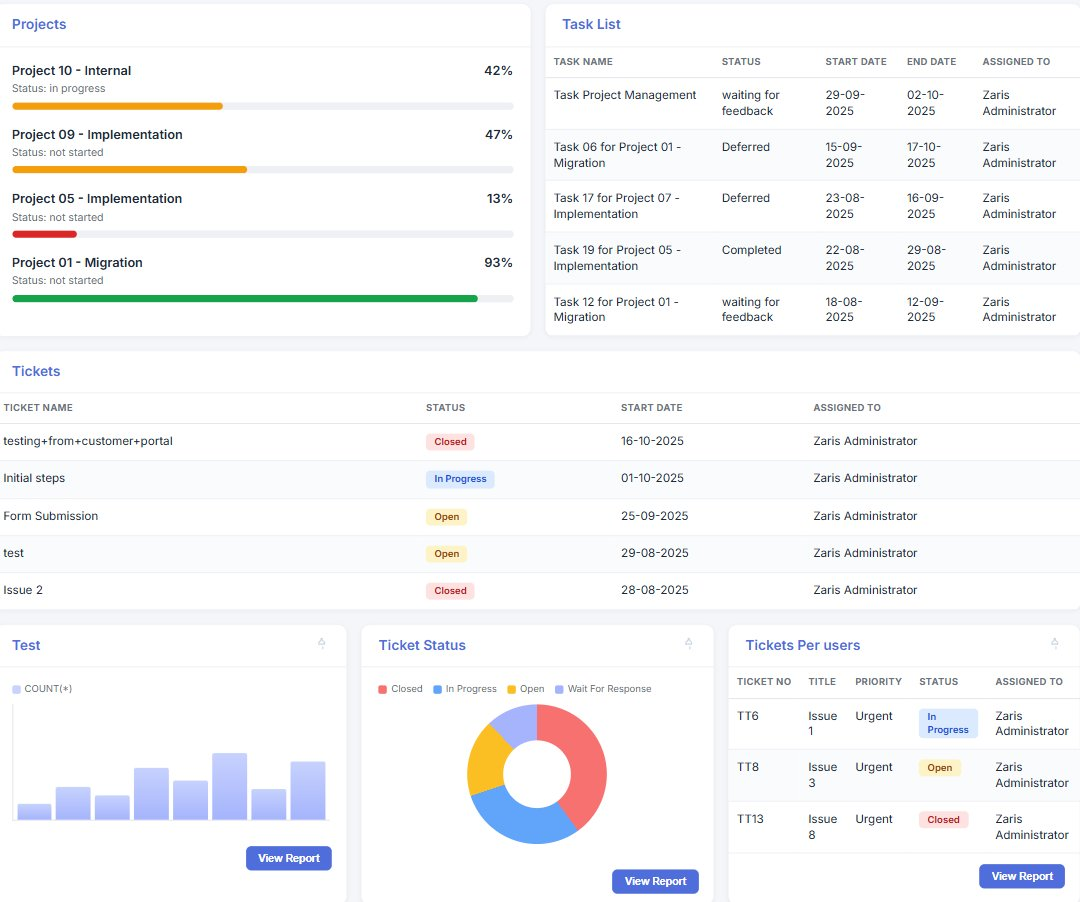
Projects & Task List – Provides real-time progress updates and task summaries.
Tickets Widget – Tracks customer support activity and issue resolution status.
Charts & Graphs – Visualize performance trends like sales growth, lead sources, or project timelines.
Use the Add Widget button to include these components based on your business focus.
Drag & Drop: Rearrange widgets freely to create a personalized, intuitive layout.
Resize: Adjust the widget dimensions to prioritize critical information.
Rename: Label sections clearly for better organization.
Zaris CRM supports multiple dashboards. You can switch between them using the dashboard tabs at the top for example, toggling between your Sales Dashboard and Project Overview instantly.
Reports Functionality
The Reports section offers complete control over how you analyze and extract your data.
Access a collection of ready-made reports such as:
Ticket Status Report – Track ticket progress and resolution efficiency.
Project Progress Report – Evaluate project timelines, milestones, and resource allocation.
Sales Report – Monitor leads, opportunities, and revenue generation.
These templates save time while giving immediate access to critical data insights.
Use built-in filters to focus on specific parameters:
Date Range – Analyze performance over specific periods.
User/Department – Review data from particular teams or individuals.
Category/Status – Narrow results by project phase, ticket status, or sales stage.
Once a report is generated, you can export it in various formats like PDF or CSV for documentation, presentations, or advanced analysis. This makes collaboration and record-keeping simple and efficient.
Empower Your Decisions
The Reports & Dashboards module empowers every user from executives to team leaders to visualize data their way. Whether you prefer quick insights from dashboards or detailed breakdowns from reports, this module ensures you always have the right information to make informed business decisions at the right time.
- Dashboards deliver quick, visual, real-time insights.
- Reports provide deep, structured, historical analysis.
- Together they cover every monitoring, audit and forecasting need.
