 Skip to content
Listview Analytics
- Home
- Zaris Features
- Listview Analytics
Gain instant insights directly from your records.
Analyze key metrics, trends, and performance data directly within list views without exporting records. List View Analytics helps users quickly identify patterns, monitor business activities, and make informed decisions using real-time summaries and visual indicators embedded within their data views.
Visual analytics
Convert any list view into interactive charts and graphs with real-time sorting and filtering.
Record drill-down
Open any record for deeper context key fields, activities and comments alongside analytics.
KPI tiles
Mini-charts and KPI cards like Lead Source breakdown appear directly above your list data.
Instant Analytics on the Go
List View provides a compact snapshot of key metrics directly from the list view. Sales and management teams can instantly spot trends and performance indicators without generating a full report.
- Quick insights with mini-charts and KPIs.
- Helps track progress without full report generation.
- Saves time with one-click access to metrics.
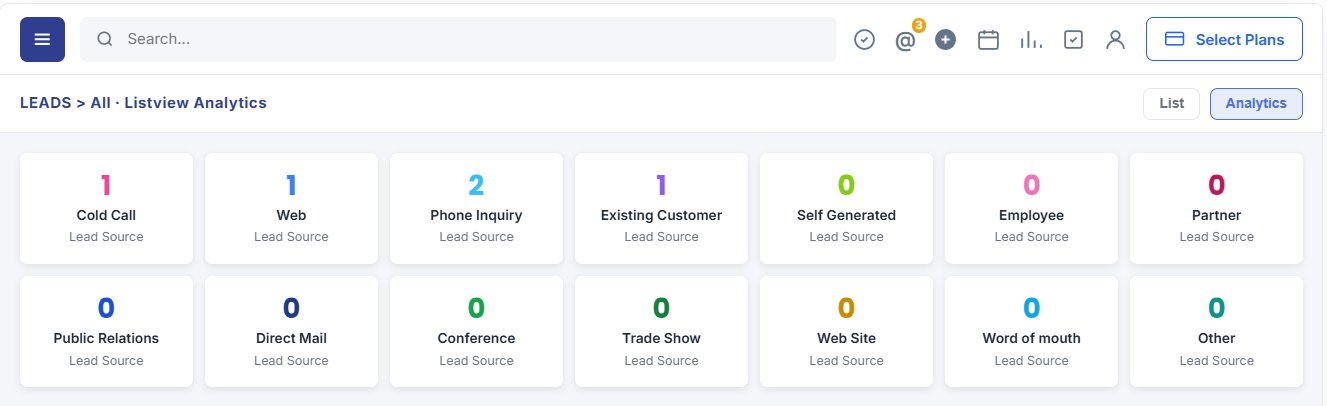
Analytics Built Into Every List
Start from familiar CRM lists Contacts, Leads, Organizations and more then switch to analytics mode to see summaries generated from the same filtered dataset you are viewing.
- Convert list view data into interactive charts and graphs.
- Real-time analytics with sorting and filtering options.
- No need for third-party reporting tools.
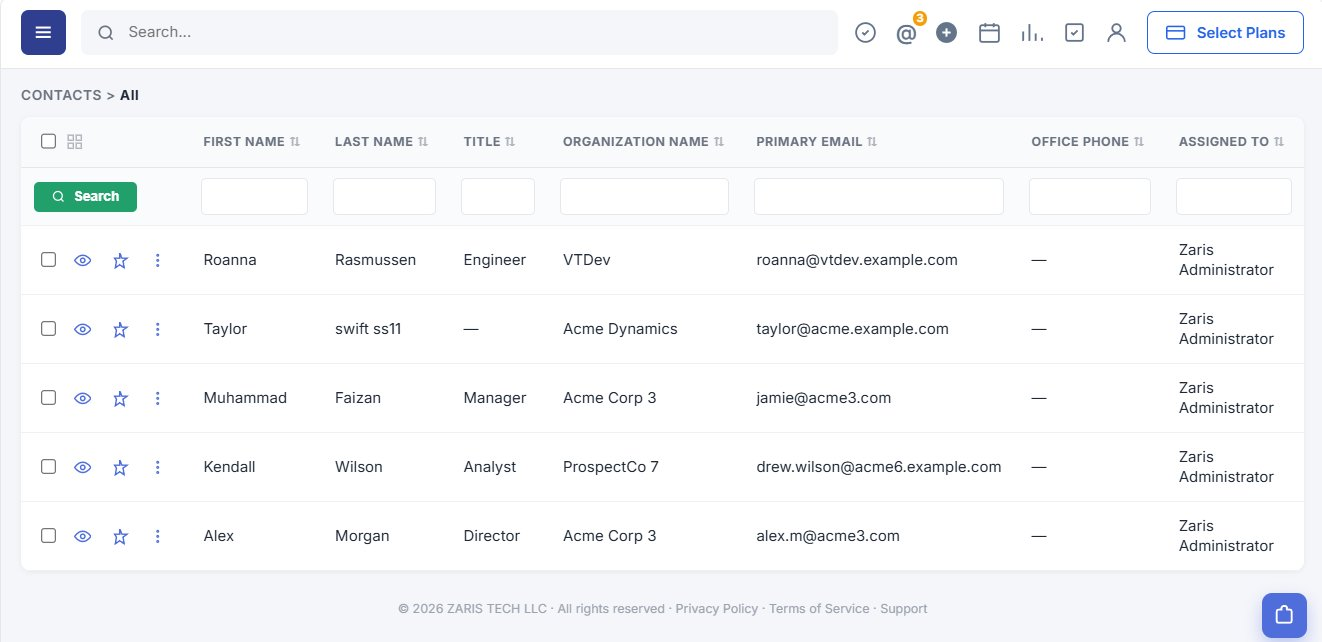
Comprehensive Data Analysis at Record Level
Detail View gives deeper insights into individual records or filtered groups. Users can drill down into opportunities, leads, or contacts to measure performance against goals.
Detailed analytics for selected records or groups.
Compare performance across sales reps, regions, or timeframes.
Supports better decision-making with granular insights.

