Skip to content
Advance Reports
- Home
- Zaris Features
- Advance Reports
Next-Level Reporting for Smarter Decisions
The Advanced Reports module enables organizations to gain complete visibility into tenant activity, subscription performance, revenue trends, payment collections, and operational metrics. Through interactive charts, detailed analytics, and customizable reporting tools, administrators can monitor business health, evaluate growth patterns, and make data-driven decisions. Whether tracking financial performance or analyzing tenant engagement, Advanced Reports delivers the insights needed to optimize operations and drive business success.
Centralized hub
All custom reports in one list name, type, module, assignee and created time with column filters.
Quick View
Preview report type, module and description from the list open full detail or post comments instantly.
3-step builder
Define modules, select columns and metrics, then apply conditions export to PDF or Excel from the detail view.
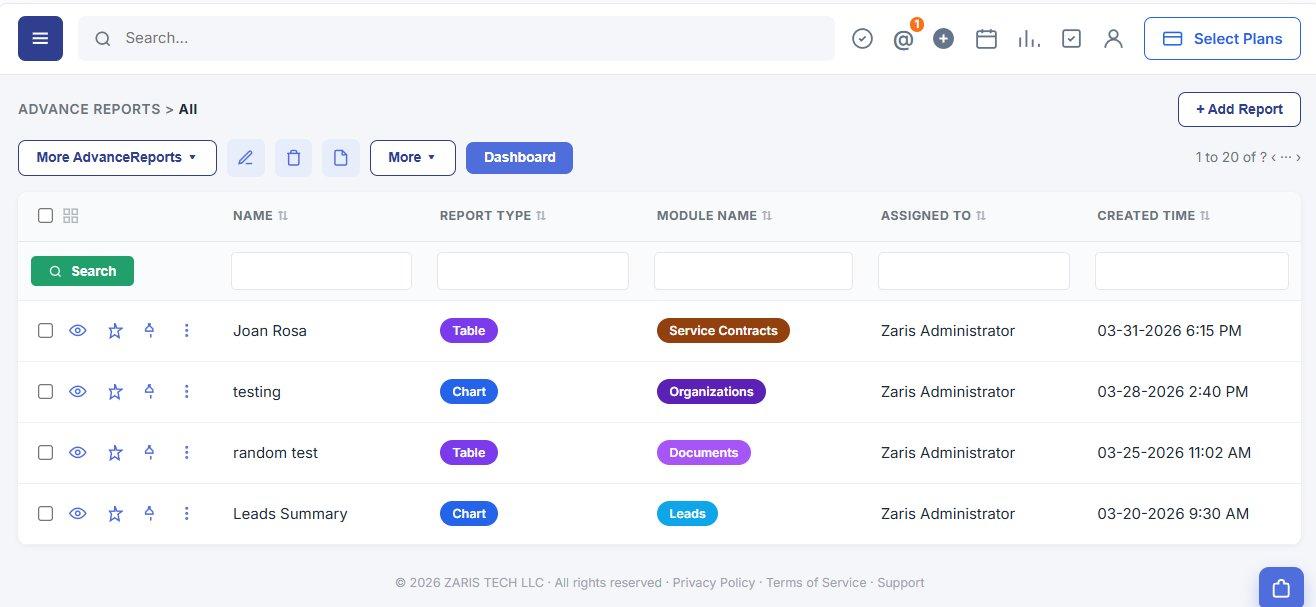
Centralized Report Hub
Manage every advanced and custom report from one table. Combine data across CRM modules, filter by report type or module name and save templates for recurring analysis.
- Centralized view of all advanced and custom reports.
- Combine data across multiple CRM modules.
- Save report templates for recurring analysis.

Fast Access to Report Summaries
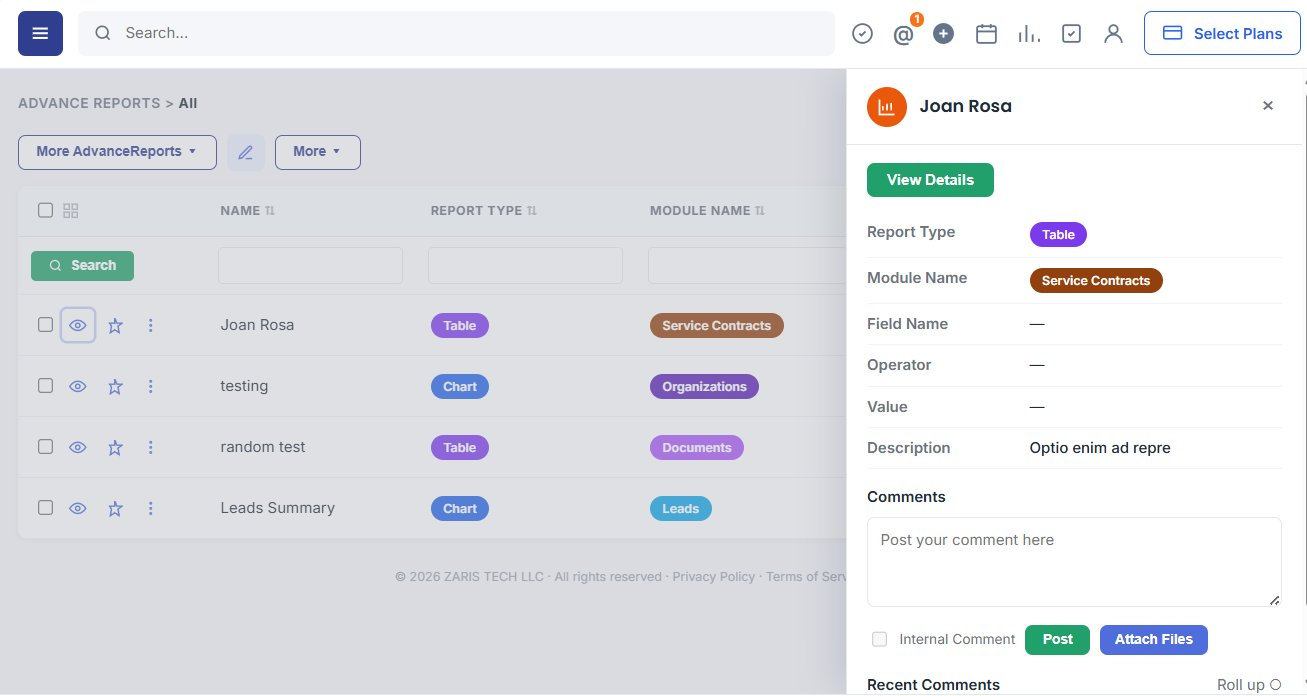
Preview report type, module and key filter fields from the list without opening the full report ideal when reviewing multiple saved reports or sharing summaries with your team.
Deep-Dive Into Customized Data
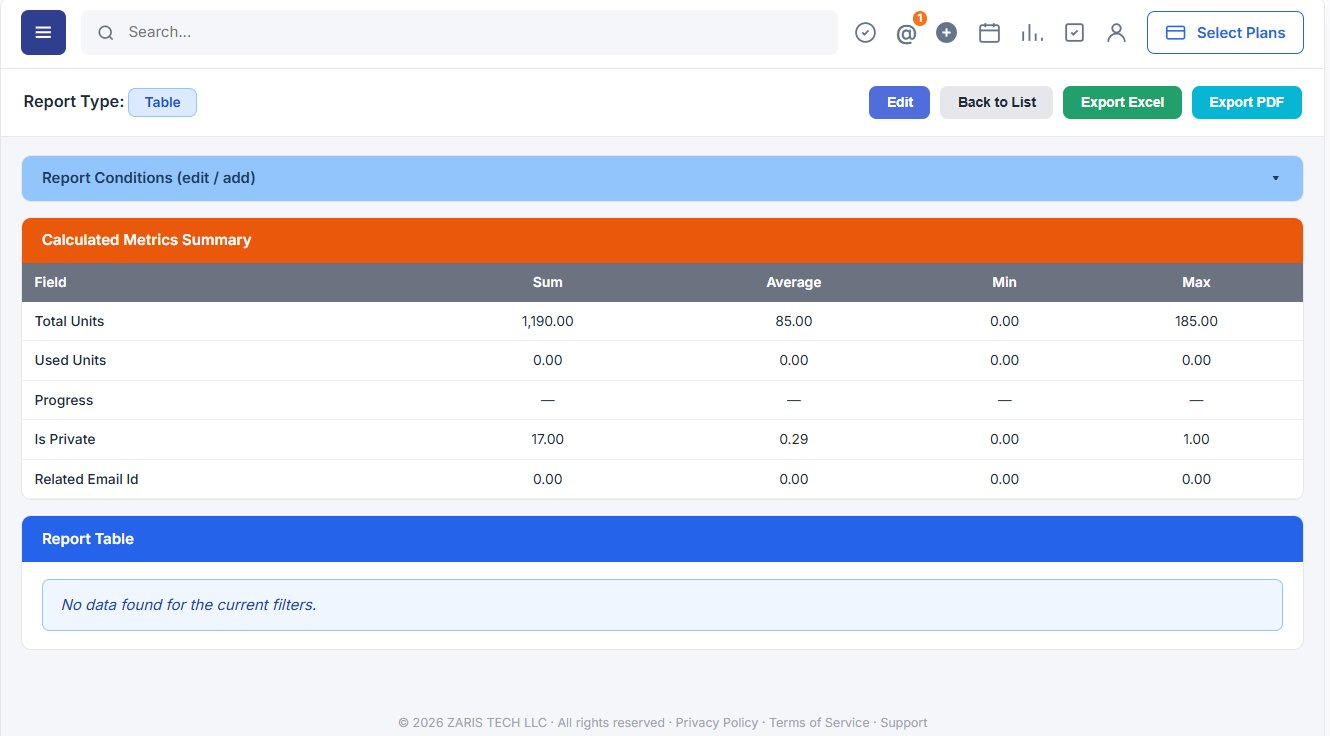
The Detail View provides a full report with complex filters, grouping, and visualizations. It allows businesses to uncover trends and analyze performance with precision.
Generate reports with advanced filters and grouping.
Cross-module reporting for complete visibility.
Export to PDF, Excel, or CSV formats.
Advanced Report Creation
The Advanced Report module allows users to build detailed, customized reports in three simple steps. First, define the report setup by entering its name, type, and related modules. Next, configure the data by selecting columns, groupings, and metrics to shape the report’s structure. Finally, apply filters and conditions to refine results and display only the most relevant information. Together, these steps provide flexibility and control to generate powerful, data-driven insights.
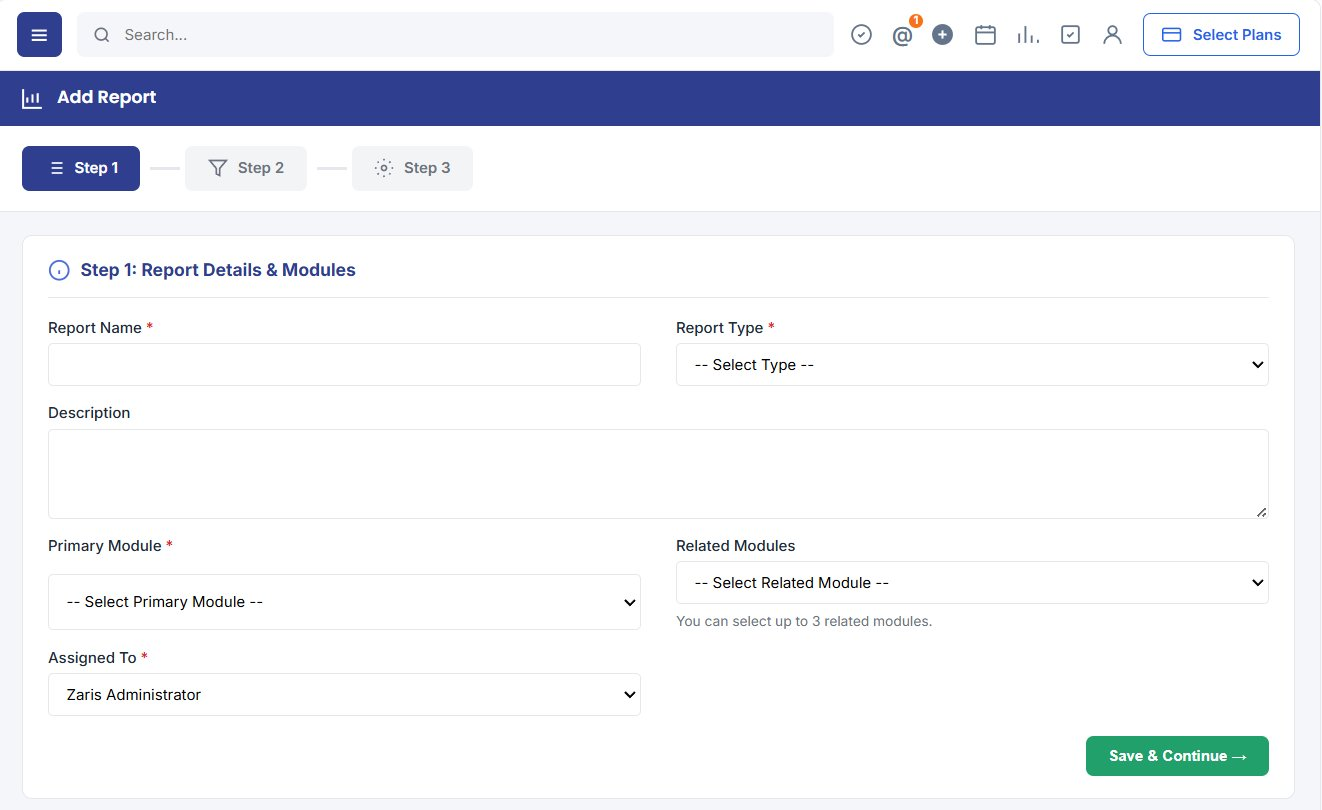
Step 1: Report Details & Modules
In this step, you define the basic structure of your report.
Report Name: Enter a unique and descriptive title for your report.
Report Type: Choose the output format (e.g., Table, Summary, etc.).
Description: Provide details to explain the purpose of the report.
Primary Module: Select the main module from which data will be fetched.
Related Modules: Link up to 3 related modules for more comprehensive reporting.
Assigned To: Assign the report to a specific user for management.
🔹 This step sets the foundation of your report by defining what data will be pulled and how it will be categorized.
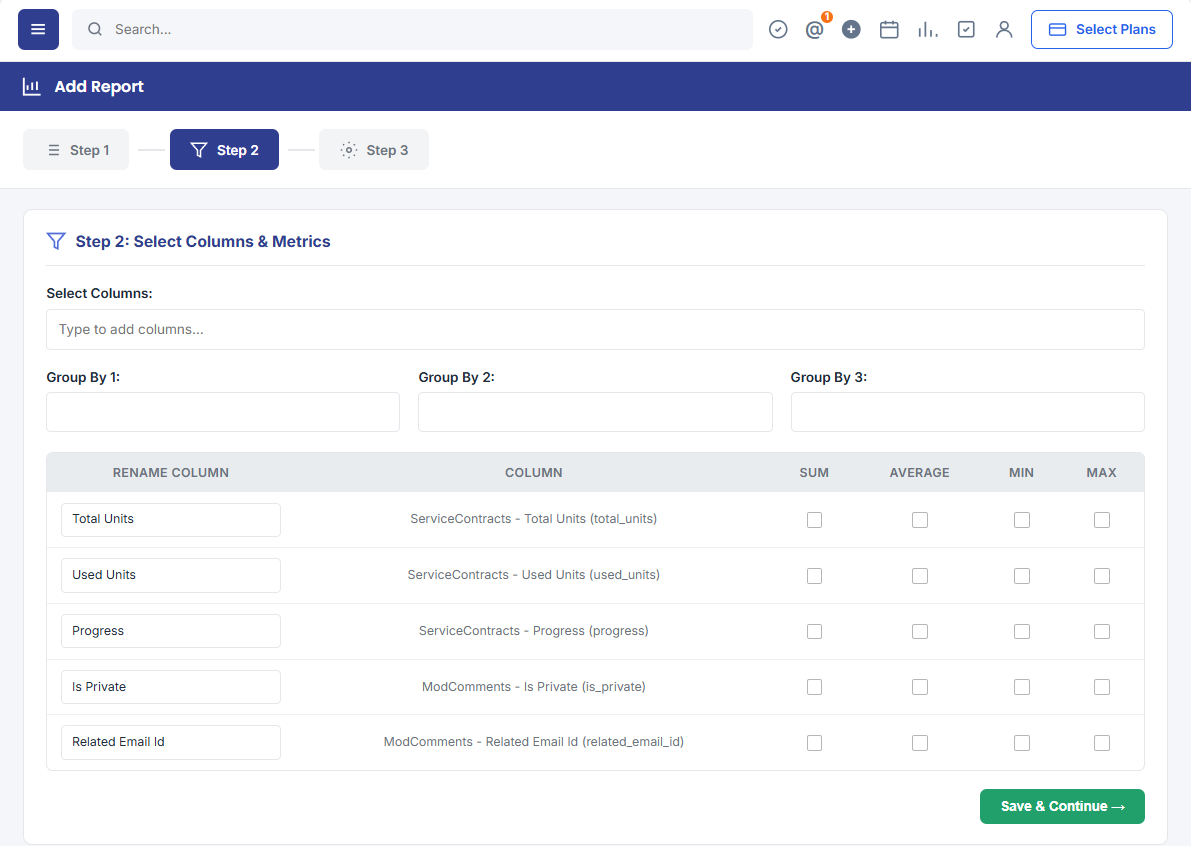
Step 2: Select Columns & Metrics
Here, you configure the data fields and calculations for your report.
Select Columns: Add fields (like ticket number, title, status, etc.) to display in the report.
Group By: Organize data by one or more categories (e.g., Assigned User, Priority).
Metrics: Apply functions such as Sum, Average, Min, Max on numeric fields like Hours or Days.
Rename Columns: Customize column names for clarity.
🔹 This step helps in shaping the report structure with the exact data and calculations you need.
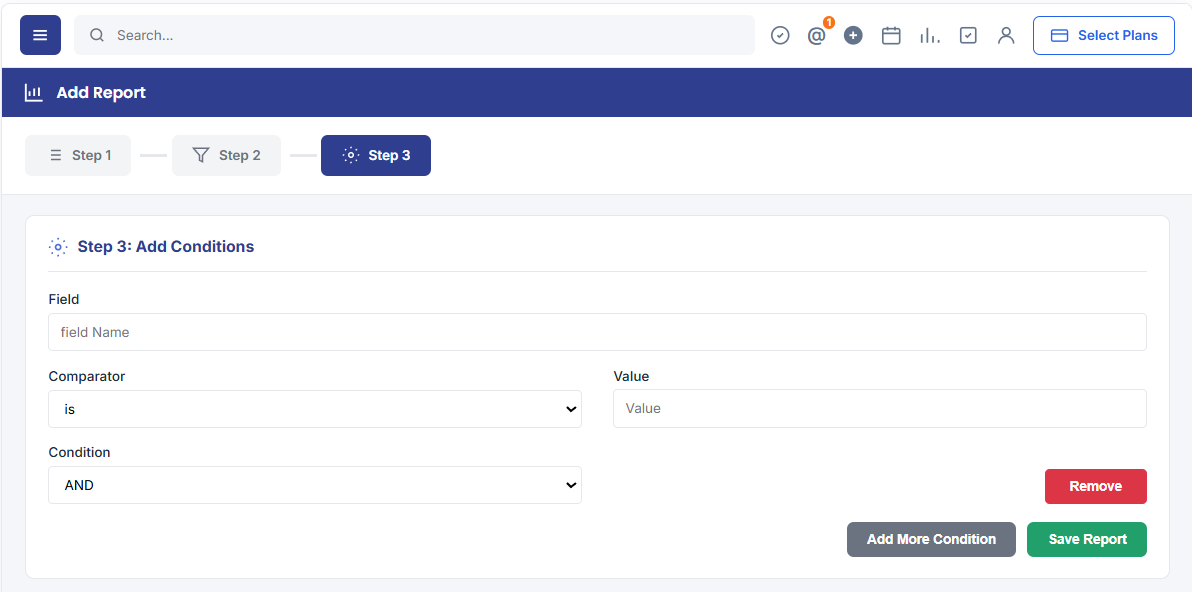
Step 3: Add Conditions
The final step allows you to filter data to meet specific requirements.
Field: Choose the field (e.g., Priority, Status, etc.) to apply conditions on.
Comparator: Define how the value should be matched (=, <, >, etc.).
Value: Set the criteria (e.g., Urgent, High, Open).
Condition Logic: Use AND/OR to combine multiple conditions.
Add More Conditions: Include additional filters for more precise reporting.
🔹 This step ensures your report only shows relevant data that matches the defined filters.